Thursday, September 28, 2006

Home builders have a new trick to try to sell you a new home: They will help you get rid of your old one.

I was absolutely shocked as I was driving on the freeway today when I listened to a commercial from Shea Homes offering to sell you old home if you buy a new one from them. This type of strategy was unheard of a few years ago. I guess it’s a wake up call to all the flippers out there that spells doom. It’s amazing that with all their resources the builders are struggling to unload their new homes.

The next year should be very interesting.

Here is the link to the article: http://www.realestatejournal.com/buysell/markettrends/20060919-simon.html

Wednesday, September 27, 2006

COFI is only reason we have not seen a major crash


The 11th District Cost of Funds index (COFI) is one of the most popular ARM indexes. This index is primarily used for ARMs with monthly interest rate adjustments. Because this index generally reacts slowly in fluctuating markets, adjustments in your ARM interest rate will lag behind another market indicators. Many lenders believe COFI-indexed ARMs are some of the best deals available on the market today. The 11th District COFI is a 2-month lagging index: the index value for a particular month is not reported until the end of the next month.

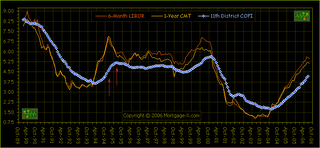
From the graph it is quite obvious that the COFI is under performing at 4.2% which combined with a 1-2% margin will save alot of folks from foreclosure however, it is trending up as soon as it gets over 5.5-6% the major crash will commence.

The chart below compares other indices with the COFI, what a huge difference in rates and in my estimation enough difference to cause this "house of cards" to fall over.

Day of Reckoning; America’s Economic Meltdown

Interesting article, the link is available, however here are some interesting points:

"The magnitude of the housing bubble is shocking and unprecedented. According to the Federal Reserves own figures, “The total amount of residential housing wealth in the US just about doubled between 1999 and 2006 up from $10.4 trillion to $20.4 trillion.”(Times Online) This tells us that the Fed had a clear idea of the size of the equity balloon their low interest policies were creating, but decided not to take corrective action. It also tells us that there will be no “soft landing”. When the market begins to fall, no one knows when it will hit bottom. $10 trillion is more than a “little froth”, as Greenspan opined; it is an earth-shaking, economy-busting catastrophe that will put millions at risk of foreclosure, bankruptcy and ruin. "

“The housing market has turned; it’s going to be down this year and even more sharply next year,” said Dan Meckstroth, chief economist an Arlington, Virginia-based trade group. (Reuters) As the housing bubble deflates, economic growth will slump, and the anticipated recession will steadily deepen. "

Flipping Activity Report

This link from HomeSmartReports contains Home Flipping Statistics for 147 Metropolitan Statistical Areas (MSA’s). Contained in these statistics are Q2 2006 results, 5-year flipping percentages, median price gainers and losers forQ2 2006 and percentages of those who lost money in the flipping process.

Interesting numbers for San Diego:


San Diego-Carlsbad-San Marcos, CA:
% Flippers in last 5 years - 4.0%
% Flippers in 2006Q2 - 3.2% (profit of $48,250 on average)
% Flippers who lost money in 2006Q2 - 27.6% (loss of $37,250 on average)

-----------------------------------------------------
Seems a bit low?

Bob

Tuesday, September 26, 2006

Flipper Gone Wild in Tierrasanta

10545 VIACHA WAY, TIERRASANTA, CA

This flipper purchased this 3 br, 3ba, 2400 sq ft home on a 7200 sq ft lot for $745,000 in May 2004. In which he seriously over-paid. He listed his home for sale in April 2006 for $999,000.

I am not the smartest person in the world but this home is nothing special, honestly it's pretty average, yet somehow within 24 months of purchasing this home this flipper believes its worth over $250K more than he paid for it.

OK.......Lets do the calculation $250k/(365x2 days)=$342/day.

Are you with me here folks because this is an amazing stat. This flipper believes you should give him $342 a day for cooking, sleeping, dumping, and showering in his home for 2 years. How stupid is that?

Well my friends that says it all......Who ever buys the p.o.s. from this flipper is unoffically the dumbest person alive.

Key Indicators to Examine When Measuring the Housing Slowdown

From The Wall Street Journal Online

With the housing market clearly sagging, economists and investors are watching a variety of gauges to get a handle on the severity of the contraction.

Last week, the Commerce Department reported that construction starts on new homes dropped 6% in August from July, to an annualized 1.665 million. That "housing starts" figure was about 5% lower than forecast and 20% lower than the year earlier 2.075 million. The month-over-month decline was the sixth one this year and put housing starts at the lowest level in more than three years.

The government estimates housing starts by surveying a sample of people who have applied for building permits. In places where permits aren't required, the process includes driving around looking for new-home construction.

Other gauges track new-home sales, existing-home sales, median house prices and the inventory of unsold homes.

New-home sales for August will be released by the Commerce Department Wednesday, and are expected to be down about 17% from a year ago. July's sales were down 21.6% from a year earlier, to an annualized 1.072 million homes sold.

New-home sales figures reflect market trends more quickly than do existing-home statistics. That's because new homes are counted as sold when the contract is signed, and existing homes are counted as sold only when the deal closes, which may be 30 to 60 days later.

Existing-home sales data, coming Monday from the National Association of Realtors, are expected to be down about 13% from August 2005. The annualized rate of 6.33 million existing homes sold in July represented an 11.2% decrease from last year.

The median sales price of existing homes, which is a good indicator of the market's momentum, was $230,000 in July, up 0.9% from the July 2005 price of $228,000, according to the Realtors group. That's smaller than the double-digit year-over-year gains posted in 2005.

Some parts of the country, including the Northeast, the Midwest and the West, are reporting falling home prices. The Realtors association has said the national median house price may fall in coming months, although any decline is expected to be limited. August numbers will be announced with the existing-home sales figures Monday.

Meanwhile, there's been a spike in the number of existing homes for sale. The Realtors group says 3.86 million homes were on the market last month, up from 2.76 million a year earlier. In addition to reflecting a diminished appetite on the part of buyers, that growing inventory may reflect the unwillingness of sellers to lower their asking prices enough to tempt buyers. With more houses for sale, buyers have less incentive to bid up prices, and home builders have fewer reasons to start construction on more units.


-------------------------------------------------------------------------------------------
Good article just don't pay attention to anything said by the Realtors association, they always caveat everything they say so they can talk out of both sides of their collective mouths.

Bob

Sellers Refuse to Accept Reality

Tuesday, September 26, 2006 Inman News

Home sales were down 30.1 percent in August compared to the same month last year, the California Association of Realtors trade group reported today, while the median existing-home price rose 1.6 percent to $576,360.

"We experienced the greatest year-to-year sales decline last month since August 1982, when sales fell 30.4 percent," said Vince Malta, C.A.R. president, in a statement. "This is another indication that we're in the initial stages of a long-anticipated adjustment in the market.
Some home sellers, he said, " are still clinging to price expectations that are no longer valid in today's market."

Closed escrow sales of existing single-family detached homes in California totaled 442,150 in August at a seasonally adjusted annualized rate, according to information collected by C.A.R. from about 90 local Realtor associations statewide.

The statewide sales figure represents what the total number of homes sold during 2006 would be if sales maintained the August pace throughout the year. It is adjusted to account for seasonal factors that typically influence home sales, the association reported.
The August 2006 median price increased 1.7 percent compared with July's revised $566,940 median price.

"Although the median price in the state and in several regions hit an all-time record in August, we expect softer prices toward the end of the year," stated Leslie Appleton-Young, C.A.R.'s vice president and chief economist.

"The median price typically peaks somewhere between June and August before declining toward the end of the year. Some areas of the state already have experienced year-to-year declines for more than two months. This is in stark contrast to the past several years when there were constant double-digit increases."

She also noted that 29 percent of homes are on the market for 30 days or less, compared with 51 percent a year ago, and the share of homes on the market for 90 days or longer has nearly quadrupled from 6 percent in August 2004 to 22 percent last month.

C.A.R.'s Unsold Inventory Index for existing, single-family detached homes in August 2006 was 6.8 months, compared with 2.6 months (revised) for the same period a year ago. The index indicates the number of months needed to deplete the supply of homes on the market at the current sales rate.

Monday, September 25, 2006

San Diego’s housing crisis – statistics and quotes

Interesting article from San Diego Housing Commission. They include many shocking and absurd stats:

Increasing housing prices vs. incomes in San Diego:

To afford a median-priced house ($550,000) today in San Diego, buyers need an annual income of about $134,000, assuming a 10 percent down payment and a 30-year fixed-rate financing at current interest rates. But according to the San Diego Association of Governments the county’s median household income is $64,273 – less than half of what is needed to afford a median-priced home here. (The Daily Transcript/MarketPointe Realty Advisors, 2/15/06)

The San Diego Association of Governments estimates that 172,000 local employees, or 13 percent of the work force, earn less than $8.35 an hour.

San Diego County’s high housing prices, coupled with its relatively low wages, make it the third least affordable major metropolitan area in the country. (National Association of Home Builders, 2006)

The median price for existing houses for December 2005 was $550,000(San Diego Union Tribune/Data Quick Information Systems, 1/22/06) – as compared to a national median price of $211,000. (National Association of Realtors, 2/28/06)

The average new detached home in San Diego County sells for $861,759 – a 350 percent increase over 1996 ($245,884). (The Daily Transcript/MarketPointe Realty 2/15/06)

Meanwhile, in the past six years the median household income in San Diego increased only 21 percent for a family of four. (San Diego Union Tribune, 7/10/05)

According to the Federal Bureau of Labor Statistics, in the past year, San Diego lost 15 percent of its manufacturing jobs (which are typically higher wage than retail and hospitality jobs). (San Diego Business Journal, 6/27/05)

According to the California Employment Development Department, some of the largest increases in employment over the past year have been in the leisure, hospitality and food service industry. And according to Center for Policy Initiatives, the median hourly wage of such service workers is $8.50. (The Daily Transcript, 2/15/06)

A 2006 report from America’s Second Harvest, a national organization of emergency food providers, found that 35 percent of its clients seeking aid must often choose between paying for food and rent. In addition, 42 percent reported having to choose between food and household utilities and 32 percent had to choose between food and medical costs.

With all these statistics how can anyone think there is no housing bubble?
Builders cater to their consumer base

My job takes me all over Southern California so I get to see how homes are priced from county to county. One thing that remains a mystery to me is how homes in areas of San Bernardino and Riverside Counties are priced higher than San Diego County.

It can’t be the location; God knows no one would want to live the torrid heat. It can’t be the job base, San Bernardino County has nothing but warehouses. It can be its easy access to LA, have you been on the 91, 60 or 10, forget about it. So what is it?

Well after much thought I have finally come to the conclusion that builders realize that San Diego consumers are better educated and will not succumb to excessively priced homes. Places like Corona, Colton, Redlands and Fontana have homes that are of the same size and quality for much more than homes in San Marcos, Escondido, Vista and Oceanside. That is not only ridiculous it is borderline criminal.

In San Bernardino and Riverside Counties builders have used shady lenders and shady lending practices to get buyers into homes that should be worth half of what you would pay in San Diego County. The builders and lenders should be ashamed of themselves for this unscrupulous behavior. Residents of these counties should know better than paying $800K for a home in Corona or Redlands and I don’t care how good the area you live in is.

October City Breakdown

In celebration of Halloween, starting 1 Oct, I will be breaking down most cities and unicorporated areas in San Diego County. We will look at the best and worst in many categories and assign ratings for just how much homes are overpriced in that city and determine the all important "flipper activity meter".

We will unmask the flippers!

Stay Tuned.......

Sunday, September 24, 2006

Exciting in Escondido


Escondido, 2004…….

Phil is a smart man, and wanted to show his wife just how smart he was. "Honey, I just bought a house in Escondido!" His wife was ecstatic, “So how much do you think we will make this time sweetie?” Phil replied, “Plenty, just watch and learn.”


Today,….

Well Phil I hate to break it you but you’re our next feature story on “This Old House Flip”. Yes, you made it here because of you’re tireless efforts to screw people of their hard earned money.

The Details

Phil purchased 1529 Hornbean Gln, Escondido, CA in the Summer of 2004 for $505k. Phil thought he would stick it out for 2 years to avoid paying the capital gains tax. Well, Phil you’re too late. Phil originally listed his home for $495K on 6/5/2006. Now he is entertaining offers between $459,900-$479,900. Good for you Phil you have impressed your wife by sticking to your guns. However, you have been on the market for over 3 months, its time to start chopping again.

Thanks for playing the flipping game

Are you next?

Top 5 Flips Gone Bad

Ladies and Gents,

I present to you the Top 5 Flips Gone Bad in San Diego County. With the way the market is currently behaving this will no doubt be a living document always ever-changing.


I know there are much more sellers in worse situations however, this list maps homes all over the county basically signifying the wide-spread “flips gone bad” scenario is not isolated to one community and that no flipper is safe.

Post your list, lets compare.